A first look at Carbon Control by WebPageTest
Just yesterday (May 9th, 2023), the WebPageTest (WPT) team shipped a new feature to the tool. They called it Carbon Control, and boy oh boy was I excited to see it finally land.
Fixes #1613
The whole idea of having carbon emissions reporting in WebPageTest goes back to a tweet from Matt Hobbs in 2021. In response to that, Scott Jehl (who worked on this feature) created issue #1613. As tends to happen, there was a flurry of early comments and suggestions (I jumped the gun on a few things 😅) but then not much noticeable action thereafter.
Fast forward just over a year, and I found myself starting to have conversations with Tim Kadlec, then Director of Engineering at WPT, about what carbon emissions results might look like. Having known about this since last year, I was delighted when Scott Jehl merged pull request #2867 into the WebPageTest master branch.
So, Carbon Control …
What is it?
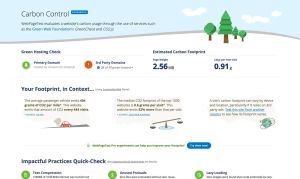
Carbon Control is a set of optional tests that can be performed with a WebPageTest run. The results are presented on an a really nicely designed page where you can see:
- If your site is served from a green web host.
- How many third party requests are served from green web hosts
- Your sites estimated carbon footprint per new (uncached) visit
- Contextual information about the estimated footprint
- Suggested improvements
- And a breakdown per resource type
Carbon Control is a terrific first step, especially coming from such a widely used service like WebPageTest. It doesn’t try to present too much information, but the information it does surface is presented in such a way so as not to be intimidating to the viewer.
Running a test with Carbon Control
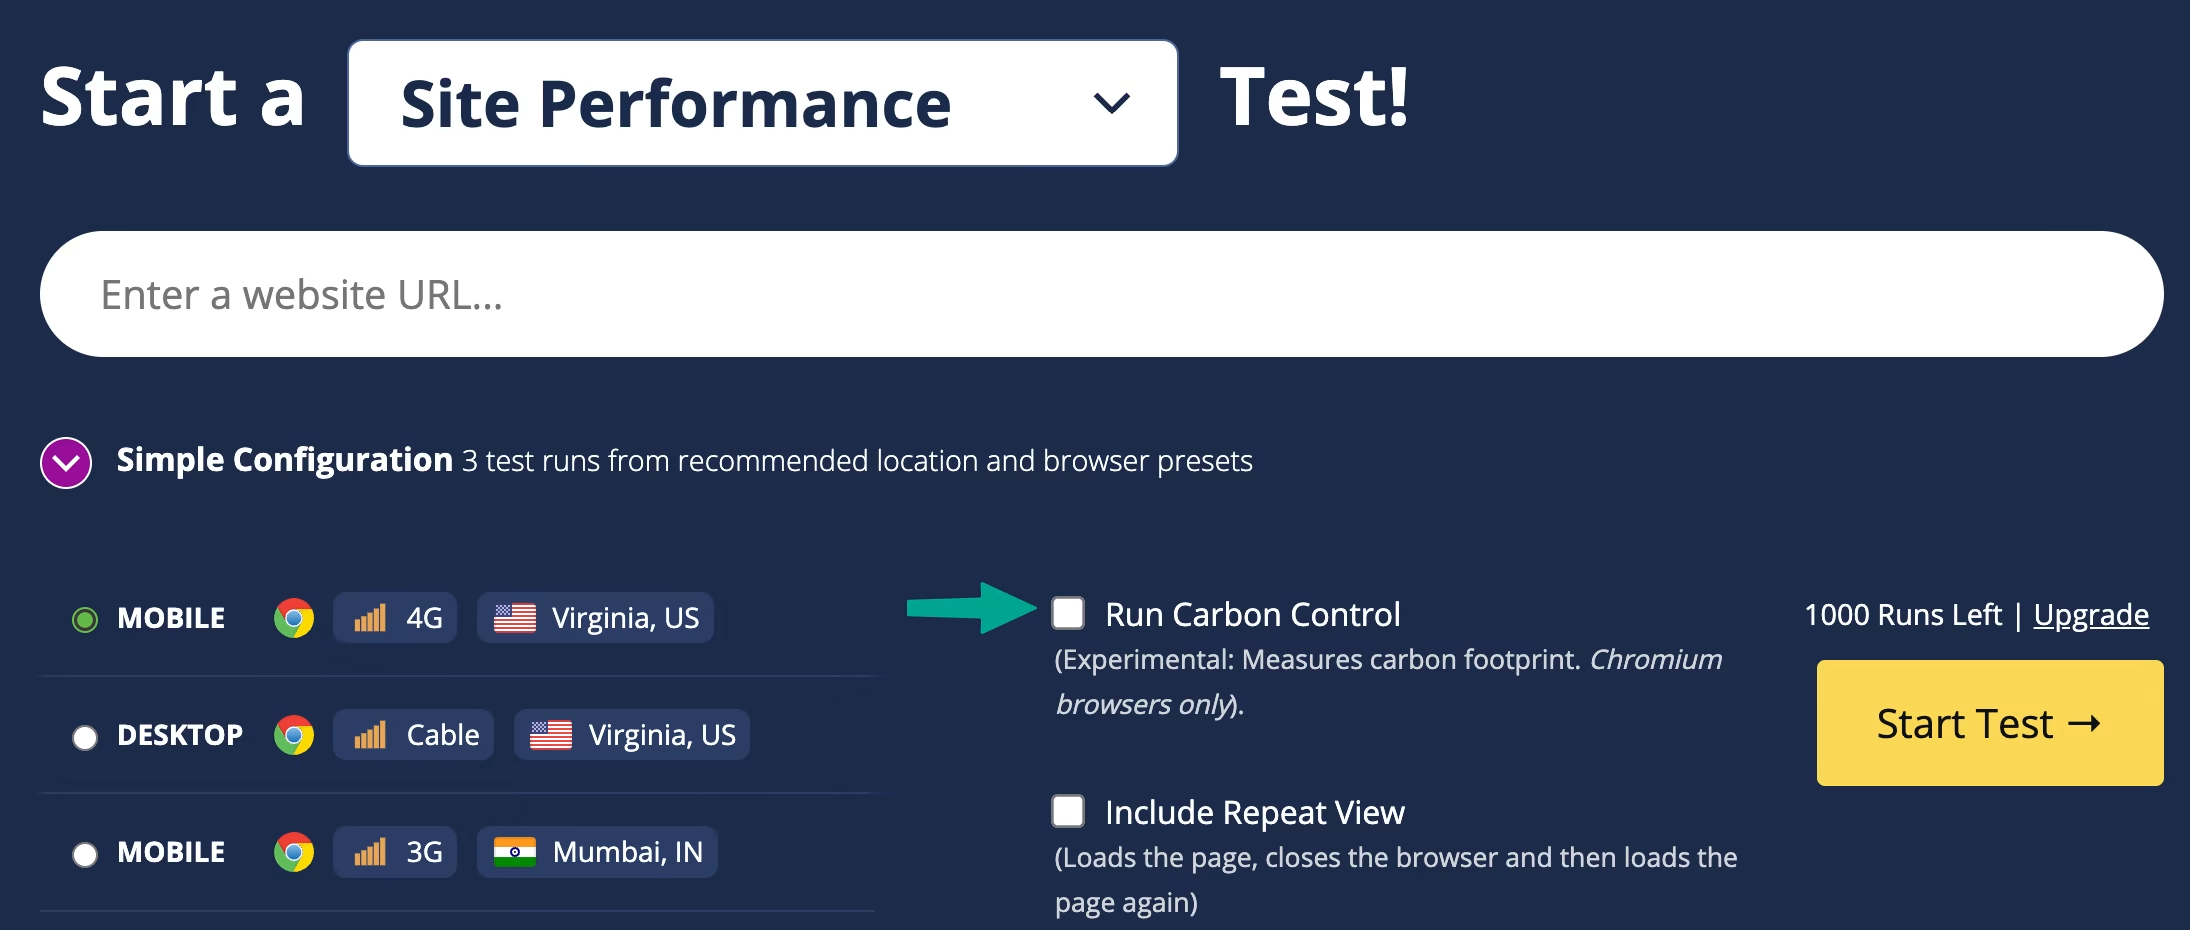
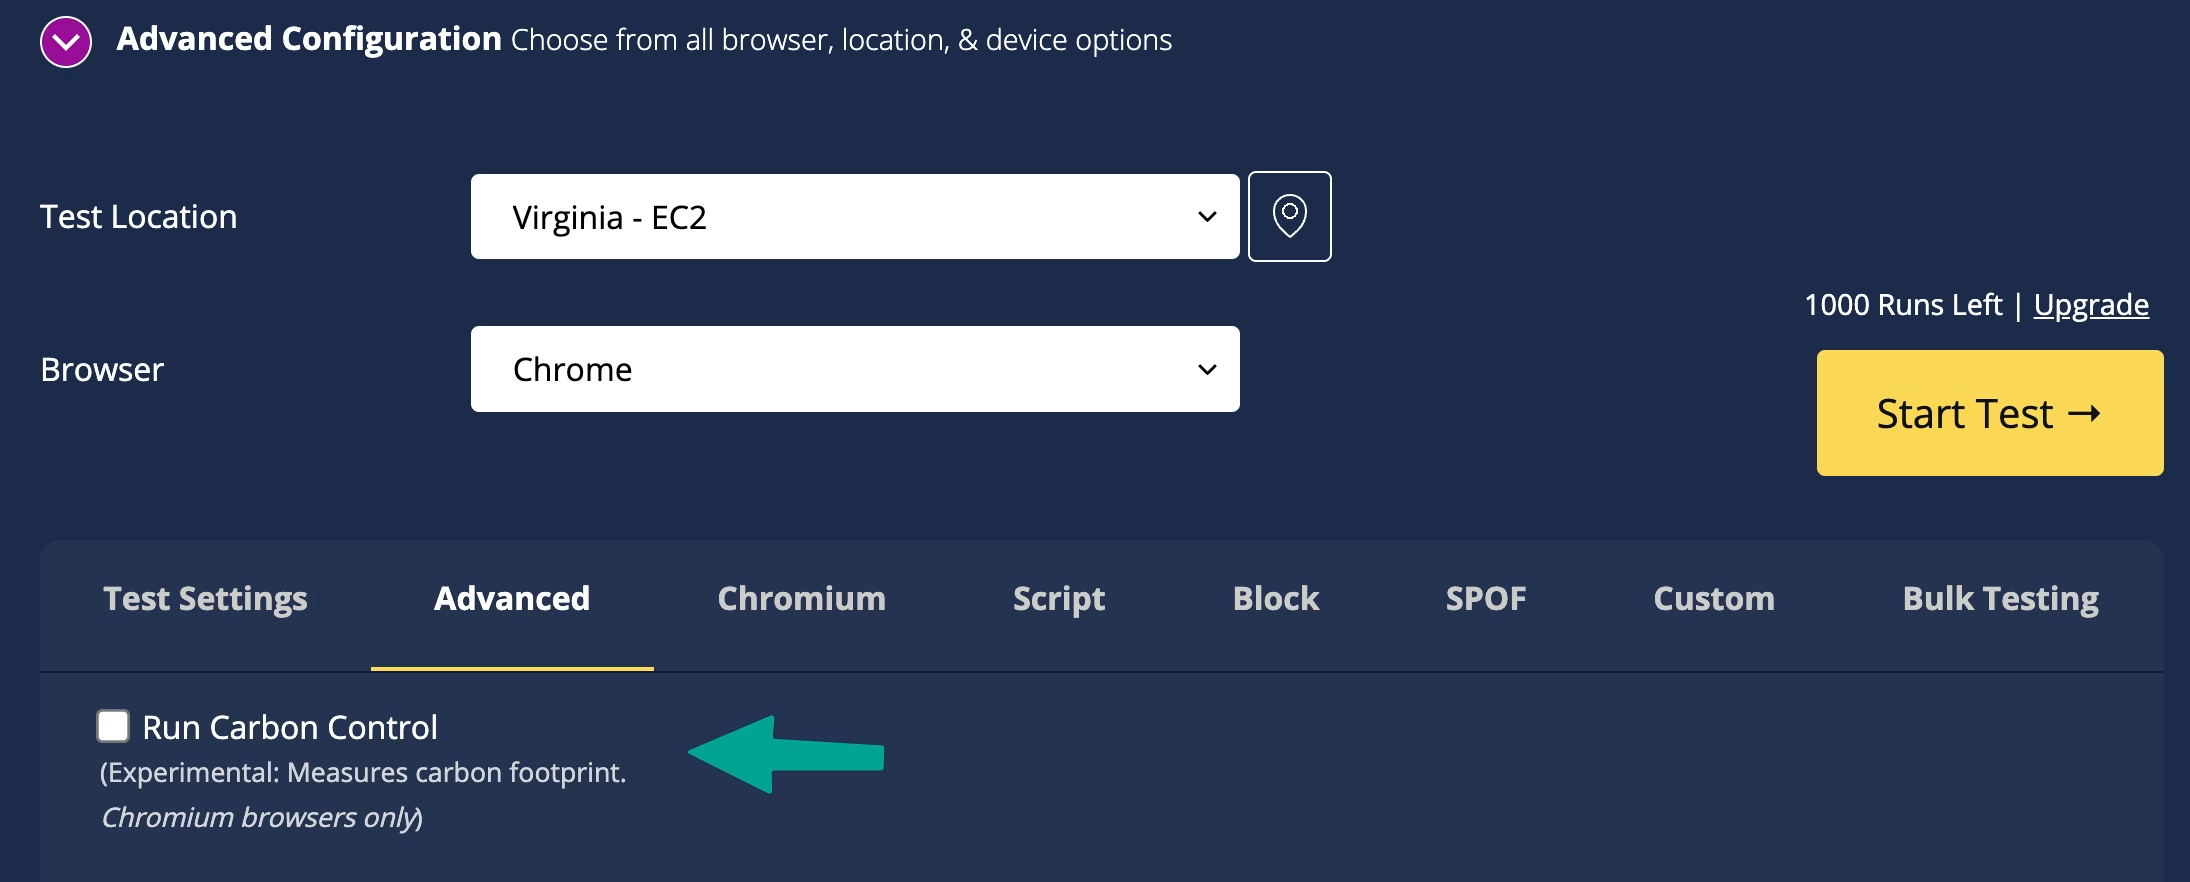
Carbon Control tests are opt-in. To turn them on for a test run, you’ll need to select the Run Carbon Control checkbox for either a Simple or Advanced Configuration test.
Alternately, the WPT team have created a special page for this feature which already has everything setup. Head to https://www.webpagetest.org/carbon-control/.
The Carbon Control results
Let’s take a whirlwind tour through the results surfaced by Carbon Control. Once your test runs are complete, you’ll be able to navigate to the Carbon Control page from the test results navigation dropdown menu.
The key stuff
The first results you’ll see on the page are green hosting checks. WPT breaks this down into two categories - the primary domain, and third-parties. The results in the third-parties check will tell you that “x of n are green-hosted”. Clicking on this will reveal a list of all the third-party domains indicating which are green & which are not.
Next up, you’ll see the total size of the page and next to that a CO2e estimate. Carbon Control uses the Sustainable Web Design model to produce its CO2e estimate. It currently does this in a way that does not factor in caching or return visitors.
Data transfer as a proxy
I was going to write a short paragraph here about using data transfer as a proxy for website carbon emissions. That short paragraph became a longer ramble, so I’ve spun it out into it’s own blog post.
TL;DR: No, but it’s the best we have right now.
Read more at: Is data transfer the best proxy for website carbon emissions?
Important to note
One really important implementation detail is that WPT calculates total website carbon emissions by summing the emissions of each individual request. This is very good step in the right direction, especially when using a generalised methodology like the Sustainable Web Design model. It’s something I’ve written about in Improving the accuracy of website carbon emissions, and it’s great to see the WPT implementation taking this approach.
Extras
These two sections are the main results Carbon Control surfaces. Below them, you’ll see some contextual comparison of a website’s carbon footprint, as well as an option to test from a different location to see how that impacts the results.
One of the other great features about Carbon Control is that it works with WebPageTest’s Opportunities and Experiments. These allow users to make “no-code” changes to their sites & test out their performance (and now carbon) impact. Having Carbon Control results are part of the Opportunities and Experiments suite finally allows us to match website improvements to estimated carbon reductions. Game changer!
Below the Opportunities and Experiments section is a percentage breakdown of emissions by resource type.
The rest of the content on the page contains resources, and a badge for folks who (I assume) are using Catchpoint’s monitoring service which WebPageTest & Carbon Control are part of.
Wish list for the future
I feel that Carbon Control is a great start, especially being in a tool like WebPageTest that is so widely used. That being said, I really hope that Carbon Control in it’s current form is just that - a start.
Here are a few ideas, updates I’d hope to see in future iterations:
- Show emissions for both new & repeat views - WPT is already capable of surfacing results for repeat views (cached results). It shouldn’t be too much of a stretch to present these on results page.
- Present more third-party information - I say this having created Are my third parties green? for this purpose. It would be great to not just have the URL of the third-party resource, but also some additional context about it. At a minimum what type of resource is it (analytics, advertising …?), what company is providing it? Having a table further down the page with this information (or even with third-parties grouped in some way) would be a nice addition.
- Using location specific grid intensities for emissions estimates - Currently it looks like WPT use global average grid intensity for all segments when calculating emissions. CO2.js (which they use for this) allows for device, datacenter, and network grid intensities to be adjusted so that more case specific calculations can be performed.
- More data in the Cache Control by Resource Type section - Currently only percentages of each request are shown. I’d like to see a bit more information here, such as bytes, estimated emissions etc.
- A breakdown of information about how the CO2e estimate was reached - This is nerdy stuff, so tuck it away further down the page. It would be nice to have a table showing all the requests & the associate bytes/CO2e figures, plus the associated server, device, and network grid intensities that were used. This gives a way for us to really trace back the headline results we’re seeing on the Carbon Control page.
- Beginning to surface device energy use - I’m not sure if WPT have a way to get this information at the moment, since it’s not programmatically accessible in browsers. However, if it’s possible, it would amazing to start seeing device level energy utilisation alongside carbon emissions. This would be the first step towards estimates that are not based on just data transfer.