Using Treo's free Site Speed Test
Treo's free Site Speed Test presents data from Google's Chrome User Experience Report (CrUX) in a very easy-to-digest visual interface. It's a great tool for businesses to start understanding how their website performs for users around the world.
This is not a sponsored post. All opinions presented here are my own.
Getting started
Head over to https://treo.sh/sitespeed and enter in a website domain. Note that the tool only takes domains (e.g. www.bbc.co.uk), not whole page URLs. Hitting enter will bring up the test report page.
About CrUX data & this report
The data surfaced by Treo's Site Speed Test comes from the CrUX dataset. There are a few things to remember when looking at CrUX data:
- The data is from sessions of Google Chrome users that have opted in to sharing this data with Google.
- The data excludes those using Chrome on iOS.
- If a site doesn't get a lot of traffic (enough for meaningful, anonymised data to be provided) then you won't see any results.
- The CrUX dataset is updated monthly.
Another thing to note is that the data you'll see in the Treo report is for the entire origin (in our case www.bbc.co.uk, rather than just the homepage or a single page.
Report sections
Past year
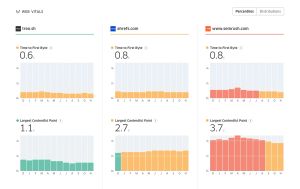
The first section of data you'll see in the report shows how the site you're testing has performed for Core Web Vital metrics over the past calendar year. You can use the Configure metrics button to add other metrics if you want.
The headline figure for each metric is the performance at the 75th percentile for that month. For example, 75% percent of recorded sessions on the site experienced an LCP of 1.7 seconds or faster. Hovering over each month will show you a more detailed distribution.
This section allows you to see changes in your site's performance over time. Since it's updated monthly the feedback isn't instant, but it's helpful for spotting larger trends.

Past 28-days
The next part of the report shows data for each Core Web Vital metric at the 75th percentile for the past 28-days. This gives a slightly faster feedback loop than the monthly graphs above. If you test your site regularly and notice these numbers going in the wrong direction, then it's a sign that you might want to review any changes you've recently made.
Geography
The Geography section of the Site Speed Test report gives a visual representation of how users around the world are experiencing your website. This can be impactful when talking about performance with managers and decision makers within a company.
Say you're an online store wanting to expand to, or increase sales in, a specific country. This section of the report will allow you to see if users in that country are experiencing a slow, unresponsive, or janky website. There's also a filter at the top of the report that allows you to show results for a specific country.
Since better Core Web Vitals does lead to increase business revenue, seeing how your site is experienced around the world allows you to be better placed to grow your business across more markets.

Form factors & Connections
The report also gives a breakdown of the type of devices being used to access your website. To be fair, you can probably use your own site analytics to get this data.
It is useful, however, in understanding why what device types are contributing to your site's CrUX data. If you have more visitors on Desktop than Phone, then you can use the filters at the top of the report to show only Desktop specific data.
The connections data is also not all that handy. Connections are often split into two categories:
- 4G and faster
- 3G (occasionally you might see 2G as well)
In most results you'll see a disproportionate percent of sessions recorded as 4G or faster. This is because the CrUX definition of a 4G connection is actually 'an effective 4G connection'. This covers anything between 720kbps through to infinity. That's a massive range, and it does reflect in the results. On the other hand, if you do see a > 20% share of 3G connections, then it's a sign you should consider optimising your site for those users.
Other things
The Treo Site Speed Test dataset is updated monthly with new data from CrUX. If you want to start using it to track the performance of your site, then there's an option at the top of the report to sign up for email updates.
The report also allows you to compare your site's results to other websites. This can be great when trying to make the case for website performance within a company. Decision makers might not fully digest the numbers, but if they see that competitor X has a 20% better LCP than your site that might just kick them into action.